DataDog is a nifty monitoring / statistics gathering system. It is something like a akin to a combination of Graphite / Grafana, but with a social aspect so that your team can attach discussions to a given point in time. They have a free tier that retains data for a day, which is handy for visualizing the state of the Minecraft server.
Java applications normally expose their statistics via JMX. I did not see anything Minecraft-specific in my stock instance, but Java itself exposes several counters that are informative.
I created my Datadog account, procured my API key, and installed the agent with:
1
DD_API_KEY = MyAPIKey bash -c "$(curl -L https://raw.githubusercontent.com/DataDog/dd-agent/master/packaging/datadog-agent/source/install_agent.sh)"
JMX is not enabled by default for Java processes, so I updated my systemd unit file in /etc/systemd/system/minecraft.service to include the JMX configuration:
1
2
3
4
5
6
7
8
9
10
11
12
13
14
15
16
17
18
[Unit]
Description = Daemon to detect crashing apps
After = syslog.target
RequiresMountsFor = /minecraft
[Service]
ExecStart = /bin/java -Dcom.sun.management.jmxremote -Dcom.sun.management.jmxremote.port=9010 -Dcom.sun.management.jmxremote.local.only=false -Dcom.sun.management.jmxremote.authenticate=false -Dcom.sun.management.jmxremote.ssl=false -javaagent:../newrelic/newrelic.jar -Xmx1024M -Xms1024M -jar /minecraft/bin/minecraft_server.jar nogui
WorkingDirectory = /minecraft/var
User = minecraft
Group = minecraft
PrivateTmp = true
NoNewPrivileges = true
InaccessibleDirectories = /home
ReadOnlyDirectories = /bin /lib /usr /etc /
ReadWriteDirectories = /minecraft/var
[Install]
WantedBy = multi-user.target
This opens JMX on port 9010 and allows remote access, though I don’t need it for this. My AWS security group will prevent any other machines from accessing jmx. I may come back to this later and implement authentication.
Datadog stores its java configuration in /etc/dd-agent/conf.d/jmx.conf, so I added the list of counters to store:
1
2
3
4
5
6
7
8
9
10
11
12
13
14
15
16
17
18
19
20
21
init_config :
conf :
- include :
domain : java.lang
type : MemoryPool
- include :
domain : java.lang
type : Threading
- include :
domain : java.lang
type : GarbageCollector
- include :
domain : java.lang
type : Threading
- include :
domain : java.nio
type : BufferPool
instances :
- host : localhost
port : 9010
The list of counters is available after the instance is configured in the yaml file by running /etc/rc.d/init.d/datadog-agent jmx list_everything:
The output looks like:
1
2
3
4
5
6
7
8
9
10
11
12
13
14
15
16
17
18
19
20
21
22
23
24
25
26
27
28
29
Not Matching : Bean name : java.lang:type=Compilation - Attribute name : TotalCompilationTime - Attribute type : long
Not Matching : Bean name : java.lang:type=Compilation - Attribute name : CompilationTimeMonitoringSupported - Attribute type : boolean
Not Matching : Bean name : java.lang:type=Compilation - Attribute name : Name - Attribute type : java.lang.String
Not Matching : Bean name : java.lang:type=OperatingSystem - Attribute name : OpenFileDescriptorCount - Attribute type : long
Not Matching : Bean name : java.lang:type=OperatingSystem - Attribute name : MaxFileDescriptorCount - Attribute type : long
Not Matching : Bean name : java.lang:type=OperatingSystem - Attribute name : CommittedVirtualMemorySize - Attribute type : long
Not Matching : Bean name : java.lang:type=OperatingSystem - Attribute name : TotalSwapSpaceSize - Attribute type : long
Not Matching : Bean name : java.lang:type=OperatingSystem - Attribute name : FreeSwapSpaceSize - Attribute type : long
Not Matching : Bean name : java.lang:type=OperatingSystem - Attribute name : ProcessCpuTime - Attribute type : long
Not Matching : Bean name : java.lang:type=OperatingSystem - Attribute name : FreePhysicalMemorySize - Attribute type : long
Not Matching : Bean name : java.lang:type=OperatingSystem - Attribute name : TotalPhysicalMemorySize - Attribute type : long
Not Matching : Bean name : java.lang:type=OperatingSystem - Attribute name : SystemCpuLoad - Attribute type : double
Not Matching : Bean name : java.lang:type=OperatingSystem - Attribute name : ProcessCpuLoad - Attribute type : double
Not Matching : Bean name : java.lang:type=OperatingSystem - Attribute name : Version - Attribute type : java.lang.String
Not Matching : Bean name : java.lang:type=OperatingSystem - Attribute name : AvailableProcessors - Attribute type : int
Not Matching : Bean name : java.lang:type=OperatingSystem - Attribute name : SystemLoadAverage - Attribute type : double
Not Matching : Bean name : java.lang:type=OperatingSystem - Attribute name : Arch - Attribute type : java.lang.String
Not Matching : Bean name : java.lang:type=OperatingSystem - Attribute name : Name - Attribute type : java.lang.String
Matching : 4/350. Bean name : java.lang:type=MemoryPool,name=Perm Gen - Attribute name : Usage - Attribute type : javax.management.openmbean.CompositeData
Matching : 8/350. Bean name : java.lang:type=MemoryPool,name=Perm Gen - Attribute name : PeakUsage - Attribute type : javax.management.openmbean.CompositeData
Matching : 9/350. Bean name : java.lang:type=MemoryPool,name=Perm Gen - Attribute name : UsageThreshold - Attribute type : long
Matching : 10/350. Bean name : java.lang:type=MemoryPool,name=Perm Gen - Attribute name : UsageThresholdExceeded - Attribute type : boolean
Matching : 11/350. Bean name : java.lang:type=MemoryPool,name=Perm Gen - Attribute name : UsageThresholdCount - Attribute type : long
Matching : 12/350. Bean name : java.lang:type=MemoryPool,name=Perm Gen - Attribute name : UsageThresholdSupported - Attribute type : boolean
Matching : 13/350. Bean name : java.lang:type=MemoryPool,name=Perm Gen - Attribute name : CollectionUsageThreshold - Attribute type : long
Matching : 14/350. Bean name : java.lang:type=MemoryPool,name=Perm Gen - Attribute name : CollectionUsageThresholdExceeded - Attribute type : boolean
Matching : 15/350. Bean name : java.lang:type=MemoryPool,name=Perm Gen - Attribute name : CollectionUsageThresholdCount - Attribute type : long
Matching : 19/350. Bean name : java.lang:type=MemoryPool,name=Perm Gen - Attribute name : CollectionUsage - Attribute type : javax.management.openmbean.CompositeData
Matching : 20/350. Bean name : java.lang:type=MemoryPool,name=Perm Gen - Attribute name : CollectionUsageThresholdSupported - Attribute type : boolean
The domain is the portion before the first : in the bean name.
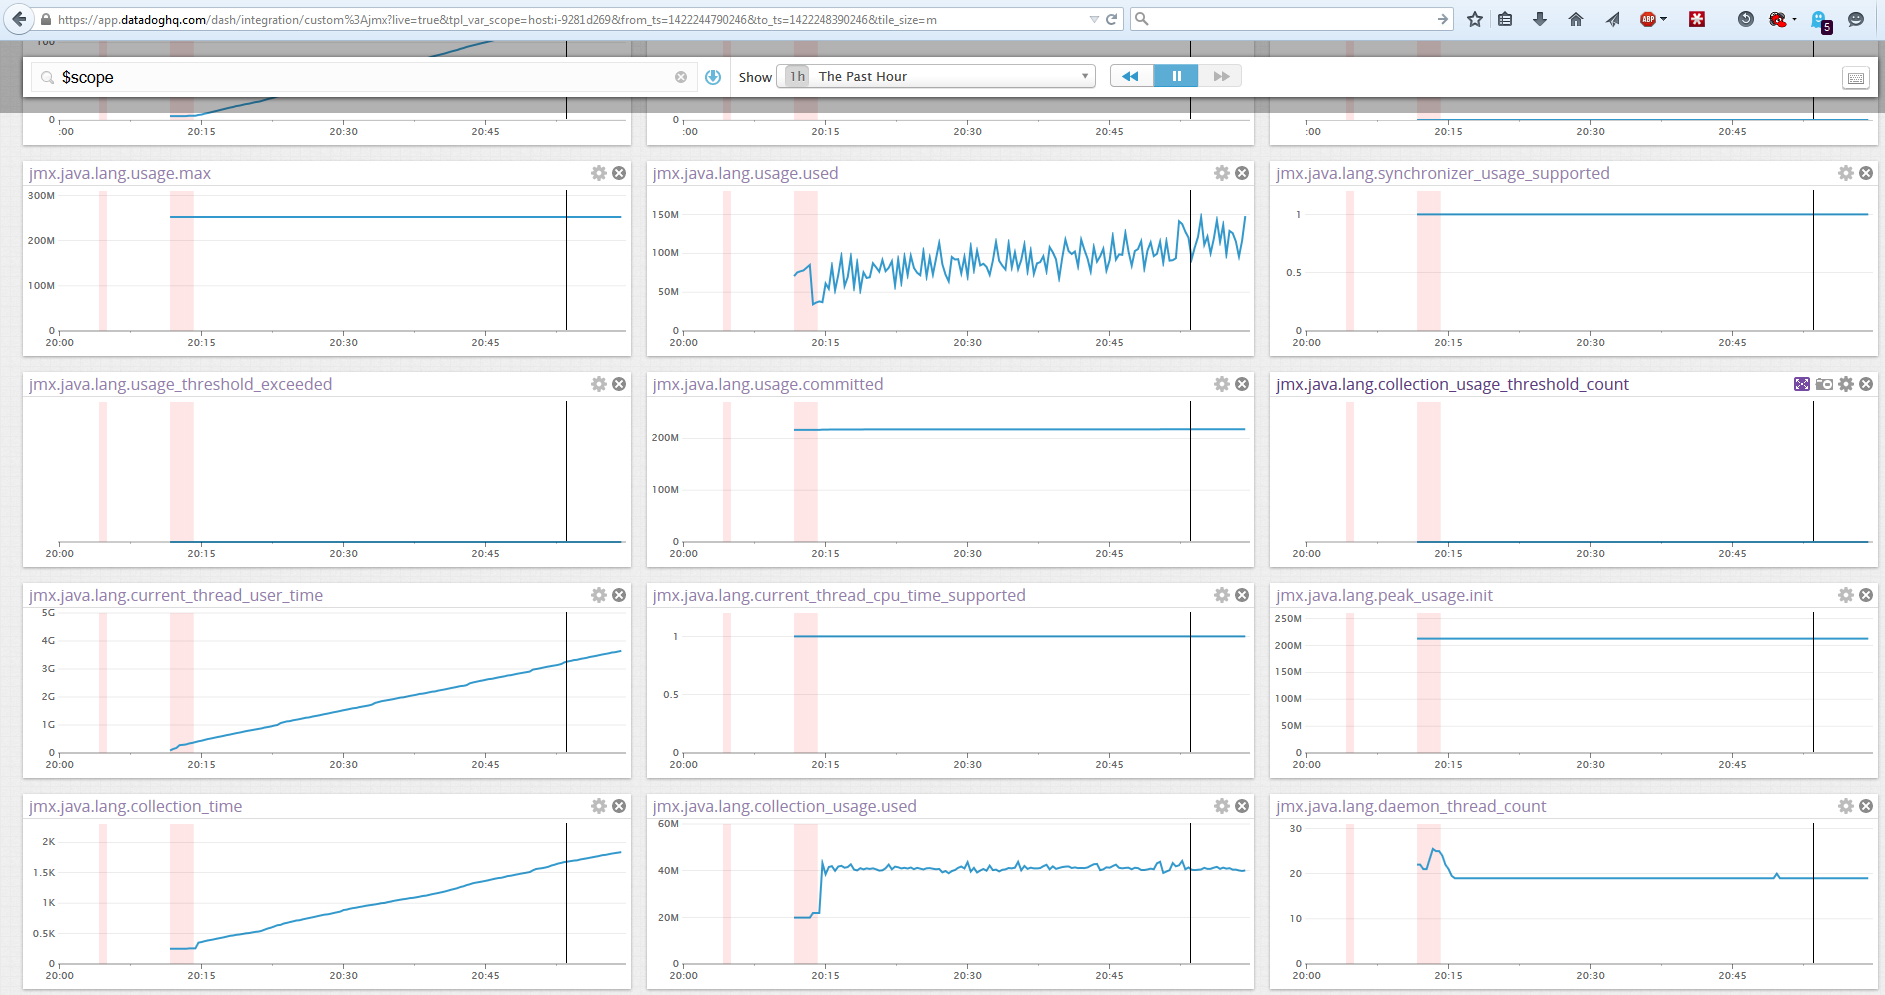
The end result is some nice free graphs out of Datadog:
The graphs for host CPU usage, threads active and java memory utilization are most interesting.